Reality plots |
  
|
Reality plots |
|
The central limits theorem is fundamental to statistics and states that if you take a set of independent randomly distributed variables, sample each one and add them up, then the probability distribution of the totals you get by doing this lots of times tends to a normal (bell shaped) distribution.
A corollary is, that if you multiply (rather than add) the input samples, the resulting distribution of products tends to a log-normal shape.
In the context of prospect evaluation, the theorem can be restated: where the fundamental processes controlling the amount of hydrocarbon reserve are multiplicative, the resulting reserve probability distribution should approach a log-normal shape.
So when REP multiplies GRV, net-to-gross, porosity, hydrocarbon saturation etc., the answer usually looks log-normal - and you can see this from any REP calculation.
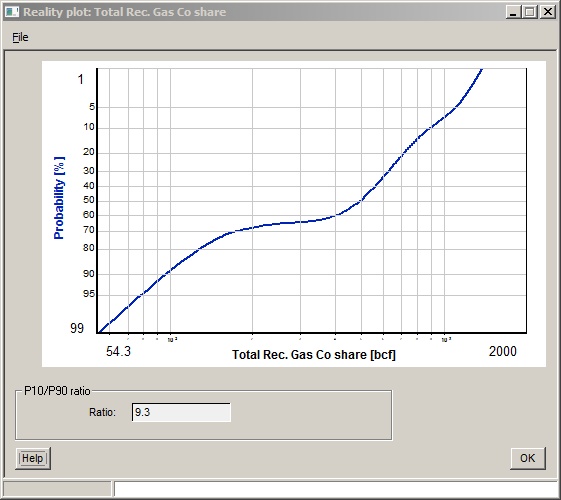
You can draw a reality plot for any probability distribution, including a consolidated distribution. In this case you are adding stuff up, and the central limits theorem indicates that the resulting distribution should be (or should tend towards) normal. Too bad!