Variable dependencies |
  
|
Variable dependencies |
|
By default, the program assumes that all variables are independent of each other. This means that within any one Monte-Carlo iteration the value chosen for a particular variable is not influenced in any way by the value that has been chosen for any other variable.
This assumption may be acceptable, but both intuition and field data suggest that it is wrong. For example, there is very often a relationship between porosity and water saturation (the higher the porosity the lower the water saturation) and net-to-gross ratio and porosity (the lower the net-to-gross the higher the porosity, or sometimes conversely). In some cases there might be a relationship between net-to-gross ratio and spill point/water contact; if the reservoir quality decreases with depth the net-to-gross will decrease as the spill point/contact gets deeper.
Although you may suspect a dependency exists, it is often hard to quantify what it is. Therefore, one question that is useful to answer is: does using a dependency make any significant difference to the result? REP allows you to answer this question very quickly.
Often the answer is: not much. But every now and again dependencies really do make a difference and in these circumstances you need to think carefully about how to quantify them.
REP allows you to define up to 20 dependencies. You may enter the dependencies in any order, the program will work out which values to pick first when it comes to do the calculation. It will also check that there are no circular references (e.g. porosity on net-to-gross and net-to-gross on porosity).
Each dependency is between two variables, one independent and one dependent. The value chosen for the dependent variable will depend on the value previously chosen for the independent variable. A variable may be both independent and dependent, allowing a "cascade" of dependency. For example, water saturation may depend on porosity, porosity on net-to-gross ratio, and net-to-gross on reservoir thickness.
There are two types of dependency: "functional" and "relational". Their behaviour is different:
·In a functional dependency, the dependent variable (y) is defined as a linear function of the independent variable (x): thus y = f(x). The dependent variable therefore inherits its shape from the independent variable. In a given iteration, the value of the dependent variable depends on the value of the independent variable.
·In a relational dependency, the shape of the dependent variable is preserved. The random number (Ry, 0<=R<=1) used to choose the value of the dependent variable is a function of the random number (Rx) used to choose the independent variable: thus Ry = f(Rx).
A relational dependency shows a more predictable behaviour than the functional, because you have complete control over its shape. If you have the data, the functional is probably better. It you just have a feeling about the relationship, the relational may be preferable.
But it should be stressed, that if you have correctly defined the dependency in each case the two should give similar results.
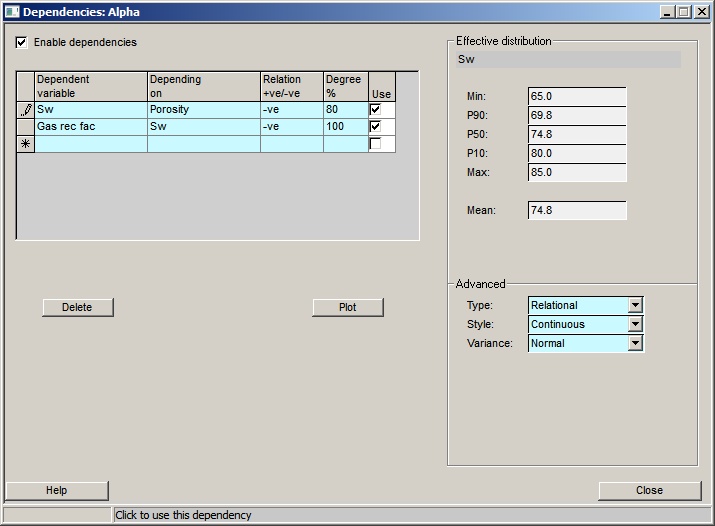
Dependencies are entered in the dialog shown here:
Enable dependencies |
If not checked, dependencies will not be used |
|
|
Table |
|
Dependent variable |
Enter the dependent variable (i.e. the one which depends on another variable) |
Depending on |
Enter the independent variable (i.e. the one which the dependent variable depends on) |
Relation +ve/-ve |
If -ve, the dependent variable decreases when the independent increases, etc. |
Degree % |
Enter degree of dependency as a percentage: 100% is fully dependent |
Use |
Click to use this dependency |
|
|
Effective distribution |
|
Min, P50, P90 etc |
The key values of the dependent variable, with the dependency enabled. |
|
|
Advanced |
|
Type |
Is the dependent variable a function of the dependent variable (functional) or are the distributions merely "linked" (relational). |
Style |
Enter the spread clipping style: continuous or clipped |
Variable shape |
Enter the spread shape around the 100% line: rectangular, triangular or normal |
|
|
Buttons |
|
Delete |
Delete the selected dependency |
Plot |
Make a plot of the selected dependency |
Close |
Close this dialog |
On the left panel you enter the dependencies. On the right the statistics for the dependent distribution are shown (you can also plot it - see below).
In the table, enter the Dependent and Independent ("depending on") variables. The other parameters required to define the dependency relation are described here. It is important to appreciate that when you make a variable dependent, the only parameters inherited from its original distribution are the minimum and maximum. All the others are determined from the distribution upon which it depends.
Relation +ve or -ve: This specifies whether the dependent variable increases as the independent variable increases, or decreases. The former is a positive ("+ve") dependency, the latter is a negative ("-ve") dependency. The increase (or decrease) refers to the mathematical value of the variable, not the impact on reserves. For example, it is commonly observed that water saturation decreases with increasing porosity. This is therefore a negative relationship.
Degree %: The percentage dependency (or degree of dependency) defines the degree to which the variables are dependent on each other. 100% dependent means that for any given value of the independent variable there is one and only one possible value for the dependent variable. Any percentage dependency less than 100% allows the dependent variable to take a value which departs from the 100%. The less the degree of dependency, the greater the possible departure.
In a functional dependency, when working out the value for the dependent variable the program first calculates the "100%" value. It will then work out a (random) departure from this value based on the dependency percentage and the variance shape (see below).
In a relational dependency, the percentage dependency is approximately equivalent to the coefficient of correlation between Rx and Ry, the random variables chosen for x and y.
Type: Functional or relational, as described above.
Style: This may be either "continuous" or "clipped", and is only relevant if the %dependency is less than 100%, and for functional dependencies. In such a case, and especially when the value for the independent variable is near its minimum or maximum - or when the degree of dependency is low - the resulting value for the dependent variable could be outside its defined limits (i.e. less than its minimum or greater than its maximum). If style is clipped then the value is constrained to be within the limits. If style is continuous the "100% value" is modified so that, for the given degree of dependency, all possible values of the dependent variable lie within the limits.
Note: Using the continuous style usually decreases the spread of the dependent variable. Use the [Plot] button to see the results.
Variance Shape: This may be either "rectangular" or "triangular", and determines the distribution of the variance from the 100% value. If rectangular, the departure from the 100% value is randomly distributed. If triangular, larger departures are less likely. Using rectangular increases the spread of the dependent variable. It is used only for functional dependencies.
For functional dependencies, the concepts are best understood with an example, and some pictures. Suppose water saturation (Sw) is 60% dependent on porosity (phi). It is a negative relationship because as porosity increases water saturation decreases. Suppose the limits for porosity are 10% to 20%, and the limits for SW are 30% to 40%. On a graph of SW vs. phi, the 100% line (clipped case) runs from {SW=40,phi=10} to {SW=30,phi=20}. Now suppose the program chooses a value for porosity of 15%. The 100% dependent value for SW is 35%. But the degree of dependency is 60%, so some departure is allowed. It is calculated as follows:
If D is the degree of dependency and the range (maximum-minimum) in the dependent variable is R, then the maximum allowed departure either side of the line is:
R x (100-D)/200
In the example: -
R = 40 - 30 = 10 saturation units
D = 60
So: -
Max departure = 10 x (100-60)/200
= 2 saturation units
In other words, the chosen SW can vary between 33% and 37%
If style is continuous, the 100% line runs from {phi=10,SW=38} to {phi=20,SW=12}. If the program happens to choose the minimum value for phi, the 100% value for SW is 38%. The allowed departure is the same as before (i.e. +/-2), so the maximum possible value for SW is 40%, safely within limits.
From the above - for functional dependencies - it follows that defining a 0% dependency does not have the same result as treating two variables as independent, especially if the style is "clipped". This is easily seen, by considering how the program works in each case.
Note: For relational dependencies, a 0% dependency is the same as no dependency: though the program might give a slightly different answer, because the random number sequence (even with a fixed seed) will be different in the two cases.
The effect of using variable dependencies is usually, but not always, small. In general, defining a positive dependency increases the mean and increases the spread. A negative dependency has the reverse effect.
[Note: Remember that SW is transformed to hydrocarbon saturation (Shc) by the program, so a negative dependency involving SW is really a positive dependency with Shc, and therefore will normally increase the mean and spread of the results.]
Use the [Plot] button to look at the data. Here are some examples. The independent variable is plotted on the x-axis, the dependent variable on the y-axis. The dark red distribution (.pdf) is that of the dependent variable when the dependency is active. (It may not be a very smooth curve - it is estimated from a short Monte-Carlo run). The feint red distribution is the original .pdf of the dependent variable. So REP will use the dark red when the dependency is enabled, and the feint red when it is not.
Figure 1 - Here SW is 60% dependent on porosity, with a negative relation (continuous):

Figure 2 - Here SW is 60% dependent on porosity, with a negative relation (clipped):

Figure 3 - This shows a positive relation, 100% dependent:
