Input variable plots |
  
|
Input variable plots |
|
Input data plots allow you to compare input variable probability distributions in a group of prospects.
Start by loading up a set of prospects in the usual way. Then choose Tools | Input variable plots from the prospect menu. This is what you get:
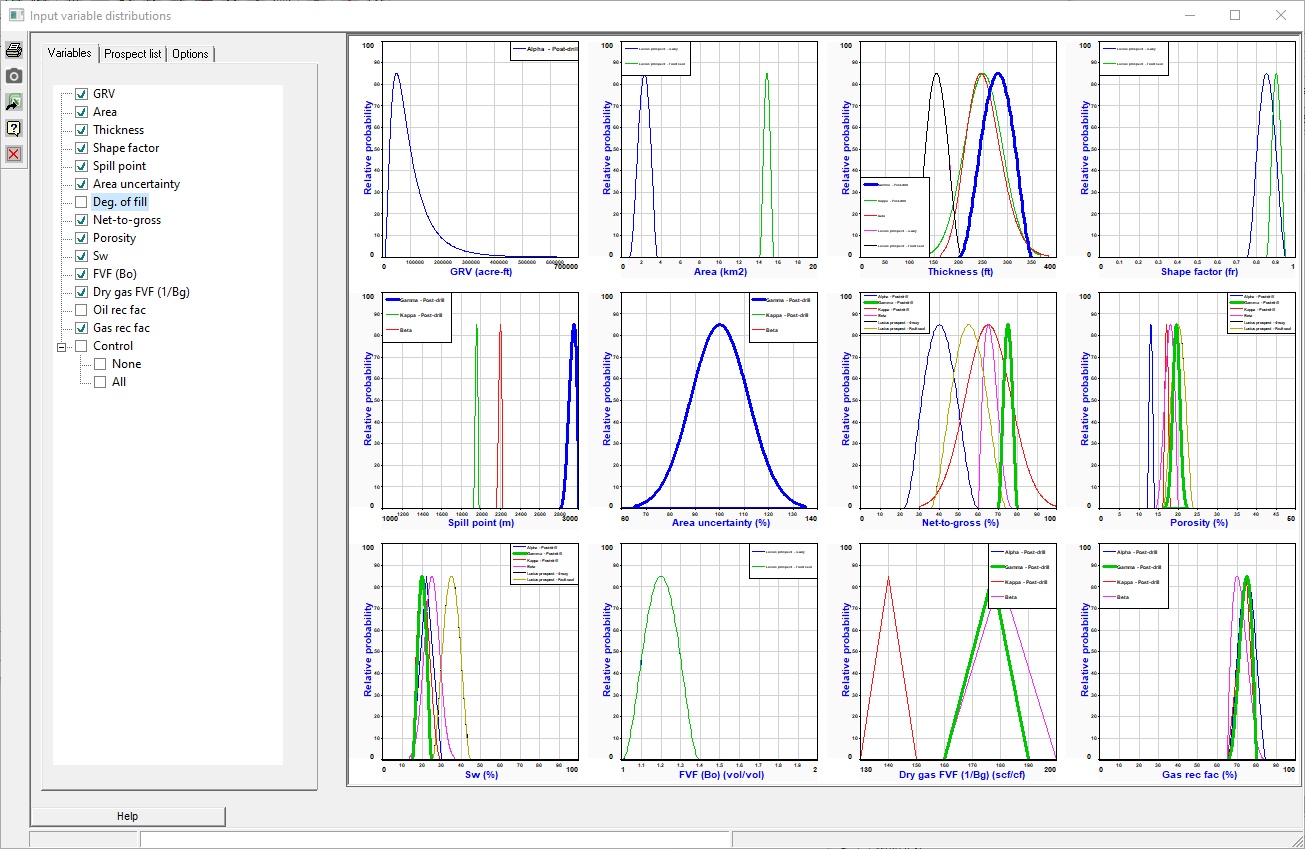
From the Variables tab, choose the input variable you wish to compare. Click a variable to plot it. Click again to remove it from the plot. All and none plots them all, or none of them.
The Prospect list tab shows the currently loaded prospects. You can switch a prospect on (![]() ) and off (
) and off (![]() ) by double-clicking (or right clicking) its name in the list. If you have models and/or layers, they are also shown and you can also double-click them to turn them on and off. This switching on and off only affects the display.
) by double-clicking (or right clicking) its name in the list. If you have models and/or layers, they are also shown and you can also double-click them to turn them on and off. This switching on and off only affects the display.
If you single click a prospect, it is drawn with a thicker line (or otherwise, depending on what who have chosen in the Options tab below).
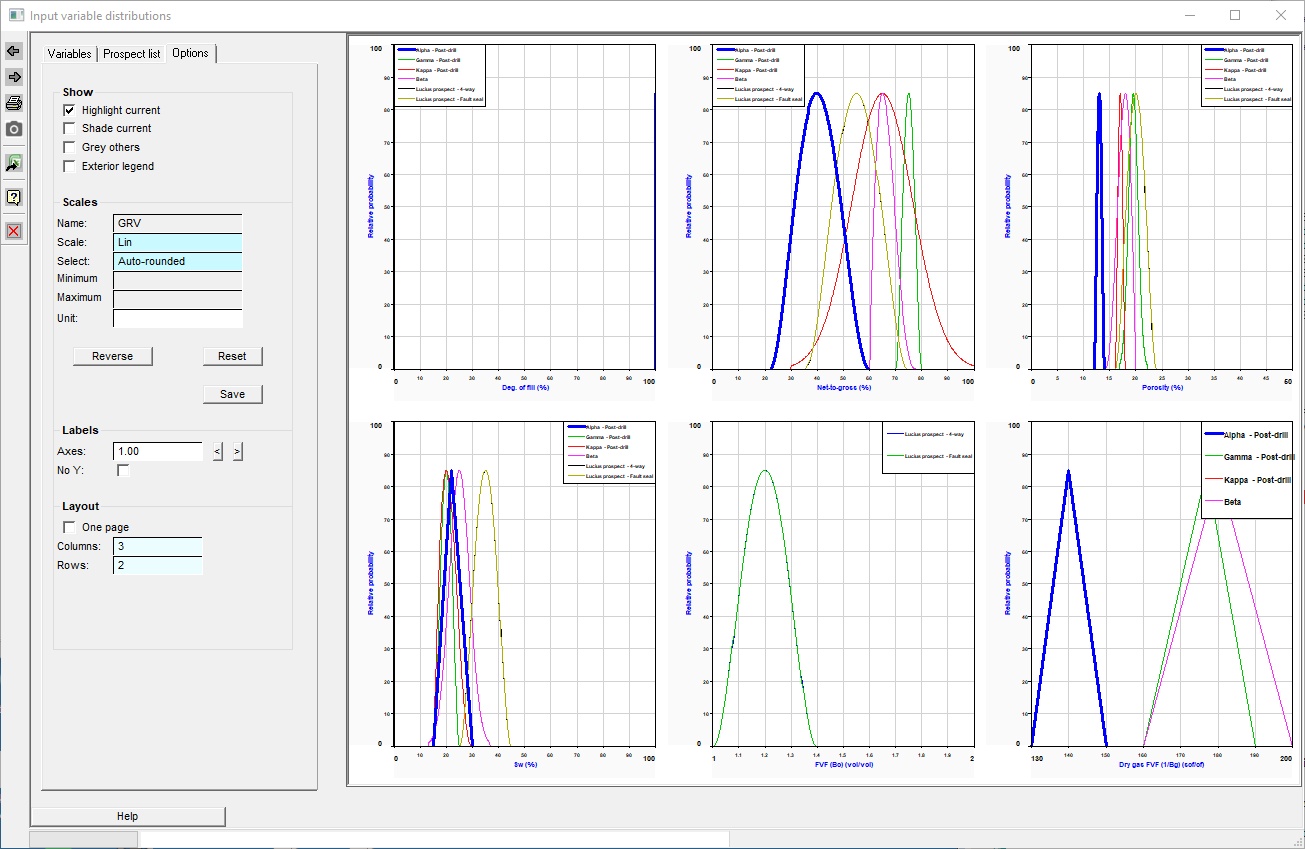
The Options tab offers a few plotting option, mostly designed to help you discover which distribution is which. but you can also set the x-axis (variable) scale. If you are working in a named project (not the "Default" project) the imposed scales will be saved with the project, when you save the project.
Options |
|
Show |
|
Highlight current |
Check to highlight selected prospect with thicker line |
Shade current |
Check to shade selected prospect |
Grey others |
Check to grey-scale unselected prospects |
Exterior legend |
Check to move legend outside the graph |
|
|
Scales |
|
Scale |
Lin or Log |
Select |
Manual (enter Min and Max below), Auto (uses the data min and max) or Auto-rounded (based on the data min and max but rounded to "nice" limits. |
Minimum, Maximum |
Scale left and right values |
Unit |
Impose a particular unit on the data: use the drop-down arrow to choose from a list appropriate to the data type. If you leave this blank it will use the unit it finds on the first distribution to be plotted. |
Reverse |
Reverse Min and Max |
Reset |
Reverts to auto-rounded scaling. |
Save |
Saves scale changes to project default (as long as you you not using the "Default" project) |
|
|
Labels |
|
Axes |
Increase the relative size of the axis labels, which can be hard to see in multi-variable plots. |
|
|
Layout |
|
One page |
Check this box if you want all variable plots shown on one page. |
Columns/rows |
How many columns or plots, and how many rows do you want? |
|
|
Icons |
|
|
In a multi-page display, go back one page |
|
n a multi-page display, go forward one page |
|
Prints to the current windows printer |
|
Copies plot to the clipboard. |
|
Sends all the plot data to an Excel spreadsheet, where you can make your own plots. |
|
Help (these pages) |
|
Close the window |