Evolution and analysis |
  
|
Evolution and analysis |
|
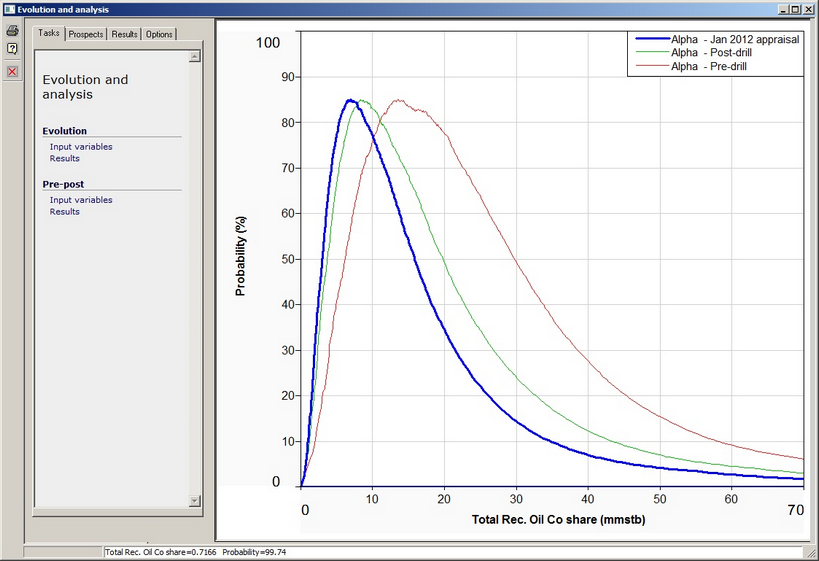
Evolutions and Analysis allows you to compare evaluations of one or more resource volumes.
You can do this for a single volume, and also compare pre-and post-drill estimates (or any other pair) for multiple prospects.
You must have one or more prospects with multiple (two or more) evaluations in them.
It may be useful to read 'Prospect Evaluation' first, in order to understand how evaluations work. To open the Evolution and Analysis dialog, choose Tools | Evolution and analysis from the prospect menu.
Tasks |
|
Evolution |
|
Input variables |
You can choose analyse input variables .... |
Results |
... or calculated results |
Pre-post |
|
Input variables |
For multiple prospects you can compare pre- and post- drill (or any two evaluation categories) - either input variables ... |
Results |
.. or calculated results |
|
|
Prospects |
|
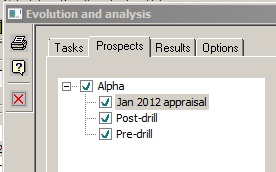
Prospects |
Select which prospect(s) you would like to plot. To toggle between showing (green tick in the little box) and not showing (no tick) either right click or double click. Turning off a prospect will disable plotting of all the historical data in that prospect. ·For evolution plots, you can show any number of evaluations ·For pre-post plots you can only show two evaluations. The later one (in date terms) is shown on the y-axis, and the earlier one on the x-axis. |
|
|
Variables or Results |
|
Variables |
Select which variable you would like to plot. Remember that not all prospects will use all variables. |
Results |
Select which result phase you would like to plot. |
|
|
Options |
|
Plot |
|
Highlight current |
Check to highlight the current prospect evaluation |
Shade current |
Check to shade the current prospect evaluation |
Grey others |
Check to grey-scale all other prospect evaluations |
Exterior legend |
Check to move legend outside plot |
Results |
|
Whole trap |
These refer to results plots only and comprise the usual options... |
Share |
... |
Technical |
... |
Success |
... |