Realizations |
  
|
Realizations |
|
It is sometimes interesting to have "actual" scenarios (values for all the input variables) corresponding to P90, P50, P10 and mean reserve cases. You can do this by choosing Tools | Realizations from the Prospect/Field dialog.
You should have already run a standard calculation before doing a realization, in order to establish the base P90, P50, etc. values.
The entry dialog looks like this:
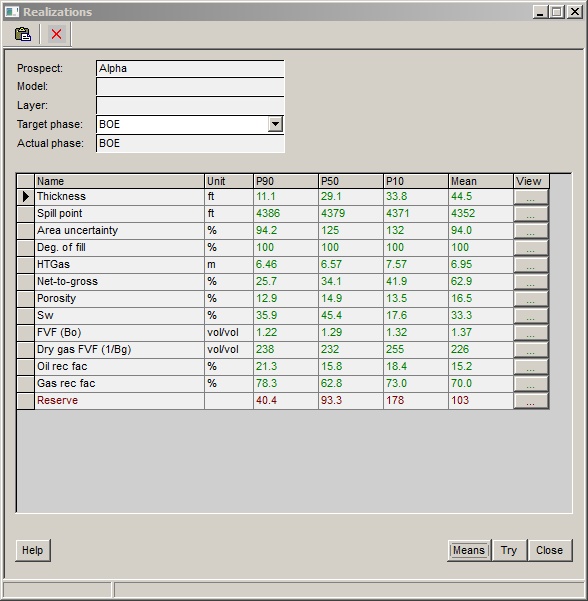
When you first start the realization, the values are blank. Click [Try] to populate the table. Successive "trying" will give different realizations. The numbers in the table are in black.
Click [Means] to take the average of 1000 "tries". The numbers are shown in green.
In the case of oil and gas or condensate accumulations, you can choose which phase (total oil, total gas or BOE) to use to match the realization.
[Note: If you choose to match on oil, the prospect P90 (for example) gas volume may not be exactly the P90 from the main calculation.]
The process always matches on total prospect volumes. But if you have different models and layers you can get a realization for each model and/or layer by clicking relevant entry in the prospect/model/layers list in the main dialog. Each time you change model or layer (or click on the full prospect) you must click the [Try] button again.

Export the results to XL by clicking the ![]() icon. In XL, just paste the table where you want it. You may have to add the model/layer names manually.
icon. In XL, just paste the table where you want it. You may have to add the model/layer names manually.
It is very obvious, but nonetheless worth pointing out, that for a given variable, its value in the P90 realization can be higher than that in the P10.
|
Copy grid to clipboard |
|
Close window |