Production profiles |
  
|
Production profiles |
|
Any production profile for an un-drilled prospect is fiction, whatever anyone may claim (your correspondent was a reservoir engineer for ten long years). However, it is often the case that your colleagues in business development need numbers to feed into their evaluation package. The REP production profile tool is designed to generate "quick and dirty" profiles so that you can keep these guys happy, with minimum effort.
It is not sophisticated and it is not meant to make your reservoir engineers redundant - however worthy a goal you may consider this to be.
Having said all that, production profiles tend to follow very similar patterns, and the simple rules allow you to construct something reasonable looking, at least. In many cases, the profile will be just as accurate as supposedly sophisticated simulation, even during the appraisal phase and possibly beyond.
It is also usually true that the value of a discovery is a function of (a) the number of wells and other development costs and (b) early production rates.
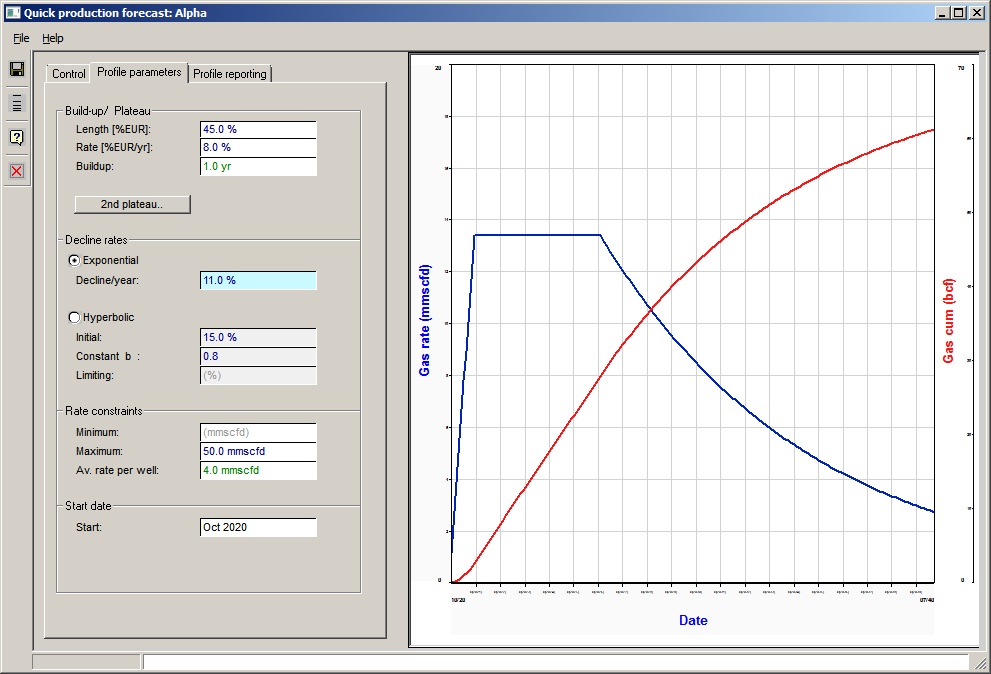
The production profiles dialog consists of 3 panels. Note that "EUR" stands for Estimated Ultimate Recovery so "target EUR" is the REP reserve; and "plateau" is that early part of the production profile where the production remains at some constant maximum for some time. A production profile may not show a plateau.
Reserve Level |
|
Level (or specified EUR) |
Click the reserve level for the profile to be generated. Note: When you save the profile, profiles for all reserve levels are made. |
|
|
Phase |
|
Oil/Gas |
The phase box shows whether the program is calculating an oil or a gas case. Oil cases will show an oil profile, gas or gas condensate cases will show a gas profile. The other phase will be written when you save the profile - see Associated Phases, below. |
|
|
Share |
|
Company/Whole trap |
The difference between the two is the net production interest in the field. When you save the profile both net and whole trap profiles are written. |
|
|
Units |
|
Oil volume |
Choose unit for oil volume |
Oil rate |
Choose unit for oil rate |
Gas |
Choose unit for gas volume |
Gas rate |
Choose unit for gas rate |
|
|
Summary |
|
Target EUR |
This is the hoped-for EUR |
Act. EUR |
This is the actual EUR achieved. If it's less than the target it is usually because the rate has dropped below the entered minimum rate for the field (entered in the next tab Profile Parameters). |
Max. rate |
The maximum production rate in the calculated profile. |
Final rate |
The final flow rate. |
Years |
The field life |
Producers |
The number of producers required, based on plateau rate and average rate per well. Should be treated with care! Average well rate is entered in the next tab, see Profile Parameters. |
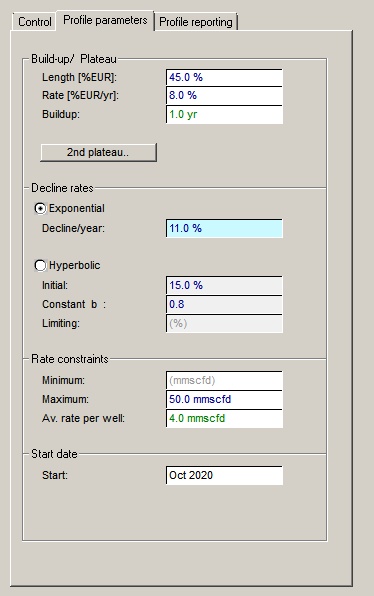
Build-up / Plateau |
|
Length [%EUR] |
Enter the plateau length as percentage of EUR. If there is no plateau (a shale gas well, for example) enter zero. |
Rate [%EUR/year] |
Enter the plateau production rate as percentage of EUR per year. Alternatively you can leave this blank and enter a maximum rate in the "Rate constraints" section below. If you do fill in a value here, any maximum rate entered below will be effective only if the rate based on this entry is greater than the maximum. |
|
|
Build-up |
Most fields take a while to build to plateau (if indeed they ever get there). Wells need to be drilled and tied in, and in the meantime everyone is hungry for income. The build-up time is the time between production start and the start of the plateau. Production is assumed to increase linearly with time. Build up is not a required entry. |
Second plateau |
Click this box to enter a second plateau period. You do not have to do this. If you do, enter the length and rate of the second plateau in the same was as for the first. Note that the length of the second plateau should be entered as the percentage of ultimate recovery at the end of the plateau. Therefore, it should be a bigger number than that entered for the first plateau. |
|
|
Decline rates |
|
Exponential |
Click to define an exponential decline. See the equation below. |
%Decline/year (De) |
Enter the decline rate per year. It is an effective decline rate: 1- q/qi where qi is the rate at the start of the year, and q the rate at the end. |
Hyperbolic |
Click to define a hyperbolic decline. See the equation below. A hyperbolic decline is usually less severe than an exponential (using typical values of "b" below) so is popular with the suits. |
Initial decline rate |
The initial decline rate as used in the equation for hyperbolic decline. It is not equivalent to the decline rate used in an exponential decline. It should be a yearly decline as a percentage. |
Constant "b" |
The constant b as used in the equation for hyperbolic decline. It must be greater than 0. If b=1 the decline is said to be harmonic. It is possible to put b>1, but it is not normally seen. Typical values are 0.3 - 0.9. note: if b=0 the decline is exponential, but the hyperbolic equation has a term (1/b) which much upsets computers. So just use the exponential decline option. |
Limiting |
Here you can enter a minimum decline rate. It has been observed that wells showing hyperbolic decline do move to an exponential decline at some point in their life - in other words, the decline rate no longer gets smaller, but just stays constant, after a while. If it comes into play at all, the effect is to reduce the EUR for any given production period. |
|
|
Constraints |
|
Minimum rate |
Enter the field minimum rate |
Maximum rate |
This is either a limiting production rate or - if no rate as percentage of EUR has been entered above - the actual field maximum rate. |
Av. rate per well |
This is only used to calculate the number of producers required, and does not affect the production profile. If you leave it blank, the number of producers is not calculated. The number of producers is worked out by dividing the maximum rate by the average rate per well - so this "average rate" does not necessarily mean the initial rate. Use with caution! Also note that there is often a link between the average rate and reserve level, especially if reservoir thickness is a key uncertainty. This is not taken into account. |
|
|
Start date |
|
Start date |
Enter the start date for the production |
Decline formulas:
Exponential
![]()
![]()
![]()
Hyperbolic:
![]()
q rate at time t
qi initial rate (time=0)
De effective exponential decline rate
D nominal exponential decline rate
Di initial decline rate (hyperbolic equation)
b hyperbolic constant.

The graphical display allows you to see what your profile looks like, but what you eventually want are the numbers.
In this screen specify the time basis for the profile: production rates can be produced at monthly, 3 monthly, 6 monthly, or 12 monthly intervals. (The basic profile is always calculated on a monthly basis.) For the Start date (optional) enter an expected date of first production.
When you click the save button, REP will write a .csv (comma delimited ASCII) file with the required profiles. You are then asked whether you wish to view the data. Clicking [View] will launch the program which is associated with csv files, which is normally Excel. (If it's not, check your file extension/program linkage in Windows.) If REP reports that there was a problem saving the file, it is normally because you already have it open in Excel. When Excel opens a file it tends to hog it, preventing any other application using it.
Time basis |
|
Time basis |
Click to choose the reporting time basis for the profile |
Start date |
|
Start |
Enter the start date for the production |
If you have an oil field with associated gas, a gas field with associated oil or a condensate field, there is another fluid phase, which is reported along with the main phase.
Associated gas and oil are simple, but the liquids phase associated with a condensate field is harder to predict, since the liquid-gas ratio varies during time. At the moment, REP just assumes a constant liquid/gas ratio. This is almost certainly an incorrect assumption. You are warned.