Decision trees |
  
|
Decision trees |
|
A Decision Tree is diagrammatic representation of a consolidation. There are two types of decision tree:
a. A summary of the consolidation hierarchy ("basic tree").
b. The consolidation with all the main outcomes shown ("outcomes tree - compressed"). Subsidiary consolidations are shown as a single entry.
Consolidations can be complicated, especially when consolidating consolidations. The good thing about a decision tree view is that it can can make clear what is going on, and especially if you have common risk.
It is also useful when trying to explain (often with much difficulty) why it is that you can't just add up prospective resource volumes - you must always account for risk. It is surprisingly common that people say: "I have three prospects of 60, 70 and 90 mmstb all with a 20% chance of success. I should discover 220 mmstb." Success in all three prospects (the 220 mmstb number) is possible, but the chance of it is less than 1% - not an attractive probability. And yet drilling programs have been funded based on such flawed reasoning....
You will know that such deception is in play when you are asked for an "unrisked consolidation" (i.e. with all the prospect GPOS set to 100%). In such a circumstance, dust off your CV. Your employer or client is on course to go belly up.
For help on production profiles (which can be made from a decision tree) click here.
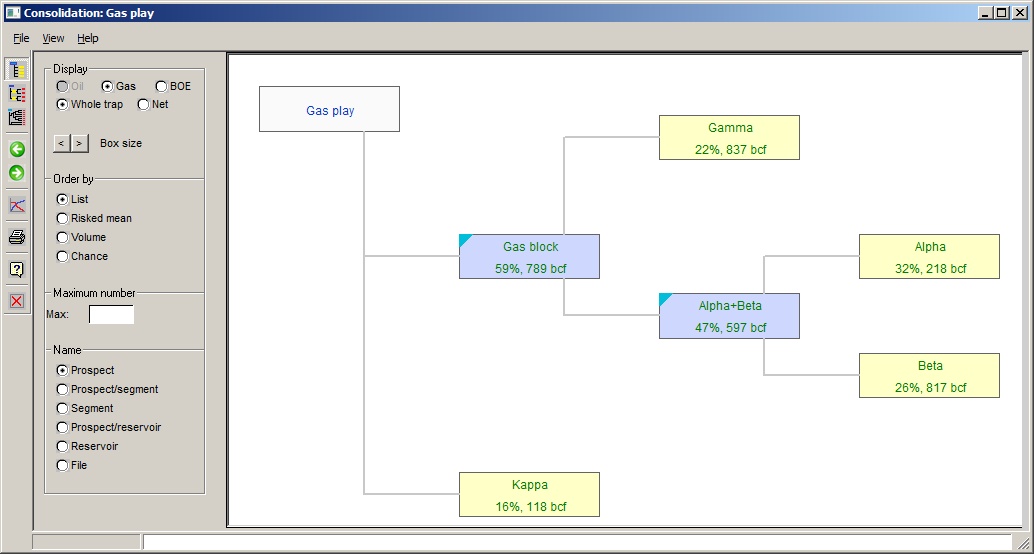
In the decision trees, prospects are shown in yellow boxes and subsidiary consolidations in blue .
Some examples:
This shows a "basic view" of a consolidation of prospect Gamma with the consolidated result of prospects Alpha and Beta:
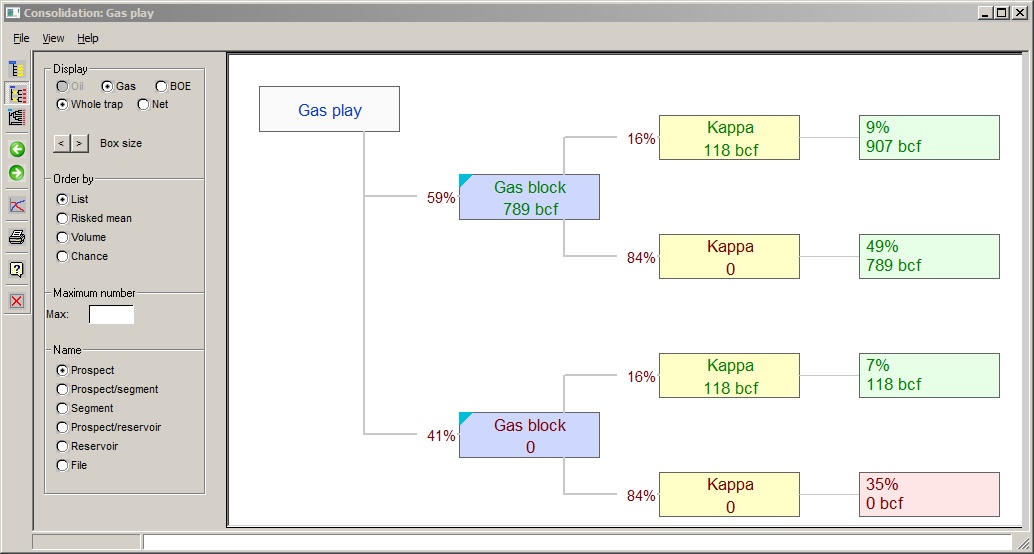
The same setup can be shown with outcomes. To do this click the "Outcomes tree (compressed)" icon ![]() :
:
Consolidation "Alpha+Beta can be shown by double-clicking in the blue box:
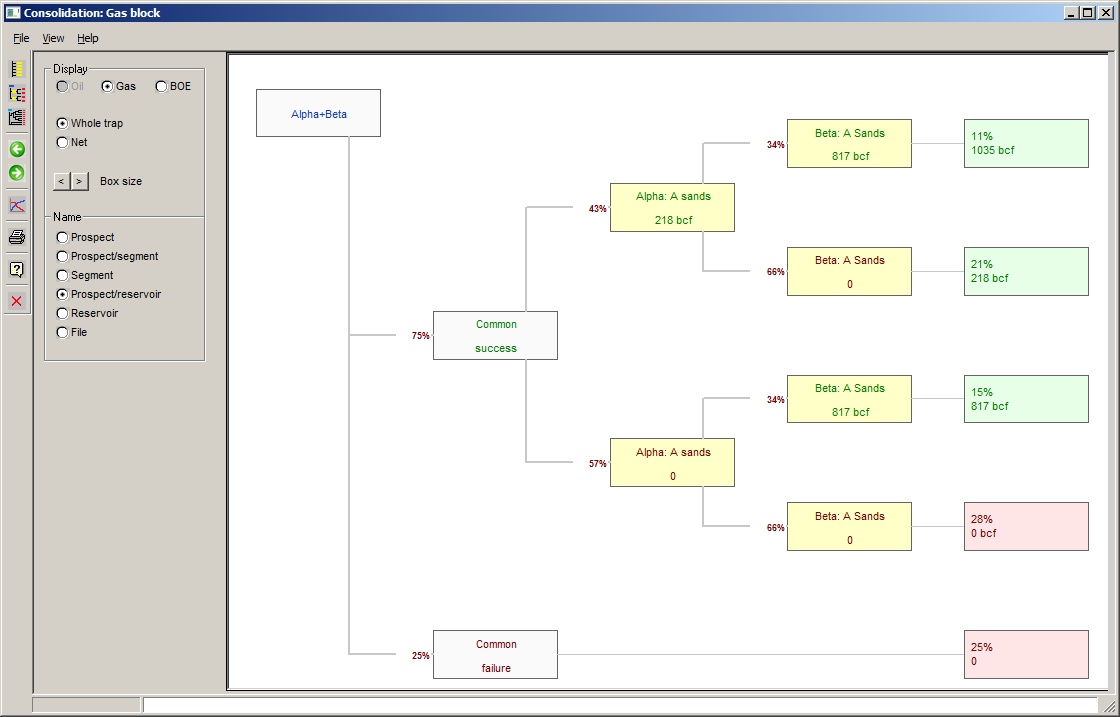
Note that the consolidation has common chance: this is shown as a first branch in the tree, "common success" and "common failure". Note that "common success" means that the common risk elements work, but if there are other, non-common risks there is still the possibility of a zero result, as shown above.
To go back to the previous decision tree view, click the back icon ![]() :
:
You can expand the "with outcomes (compressed)" view by clicking the "with outcomes (expanded)"icon ![]() . This expands any subsidiary consolidations.
. This expands any subsidiary consolidations.
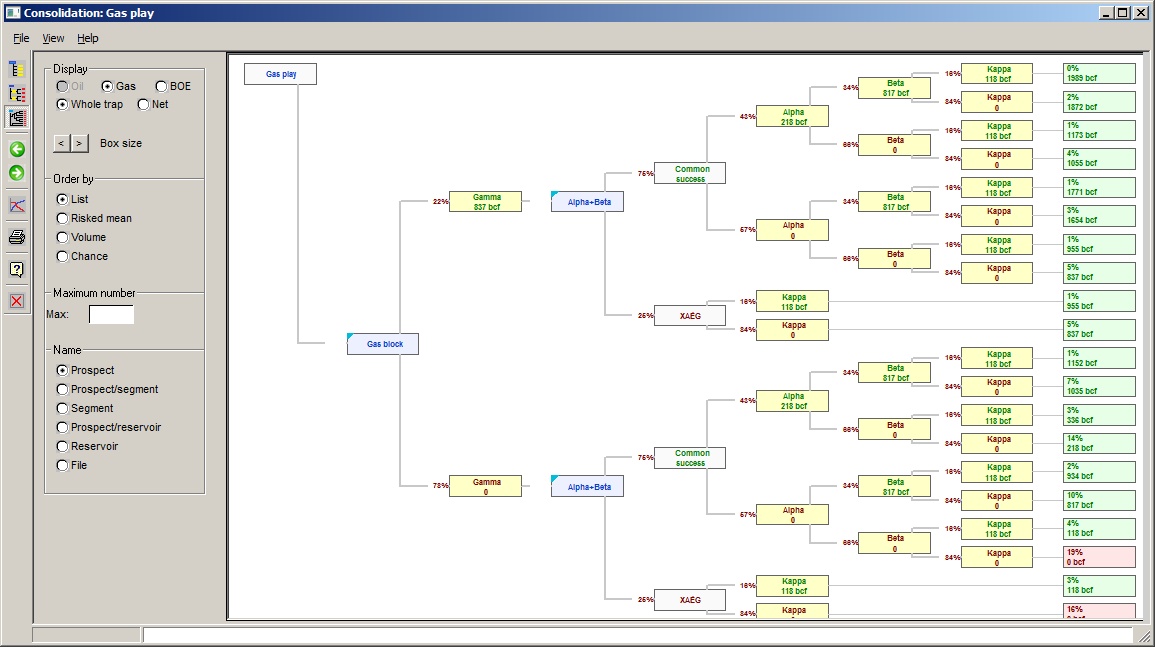
Note that the consolidation box is still displayed, but has no volume associated, this is moved to the underlying prospects, and similarly the consolidation GPOS (the branch is marked 100%, since this is after all a decision tree).
To the left of the decision tree, there are a number of options which control what is displayed on the tree. These include:
·Oil/Gas/BOE: Where applicable, display results for oil, gas, or barrels of oil equivalent.
·Volume/Expectation: Display results as volume or expectations.
·![]() The box size can be made larger or smaller by clicking these icons.
The box size can be made larger or smaller by clicking these icons.
·Order by: you can choose to order the input variables by position in the list (the default), expectation/risked mean, volume (mean) or chance of success (EPOS).
·Maximum number: this limits the display to the first n variables in the list, where n is a number greater than 2, entered here. If you have ordered your input variables by mean or risked mean, this allows you to look at the the n "most attractive". Since most companies have limited drilling capacity, this may be a very realistic.
·Name - you can choose how to label the boxes.
If you right click a prospect or consolidation box, the menu loads the prospect or consolidation into the usual dialog, where you can edit it and so on.
If you double click an outcomes box, REP will draw a production profile for the prospects that are successful in that particular outcome. See Consolidated production profiles