Dependent variables |
  
|
Dependent variables |
|
In a standard Monte-Carlo analysis, the process uses random values for each of the input variables, which implicitly assumes that there is no relationship between them. In real life (or in hydrocarbon exploration, which may or may not be the same thing) this is often not the case.
In a consolidation context, there are two forms of dependency: risk and variable. Risk dependency is discussed elsewhere under the heading common chance. Here we are concerned with variable dependency, which applies when one or more of an underlying prospect's input variables (for example, net-to-gross) is related to that in another of the input prospects.
In any one consolidation, an input variable marked as common (or shared) is assumed to be shared in all the prospects to be consolidated.
Do not be surprised to observe that with undiscovered reserves (i.e. GPOS<100%), using dependent variables has very little effect on the results. This is because the results distribution is so strongly influenced by the input GPOS's. In a typical consolidation of four prospects at 20% chance of success, each successful iteration has usually just one, sometimes two, very occasionally three and very rarely four successful prospects; so the variable dependency has little opportunity to make a difference, especially at the low end.
The entry dialog is very simple:
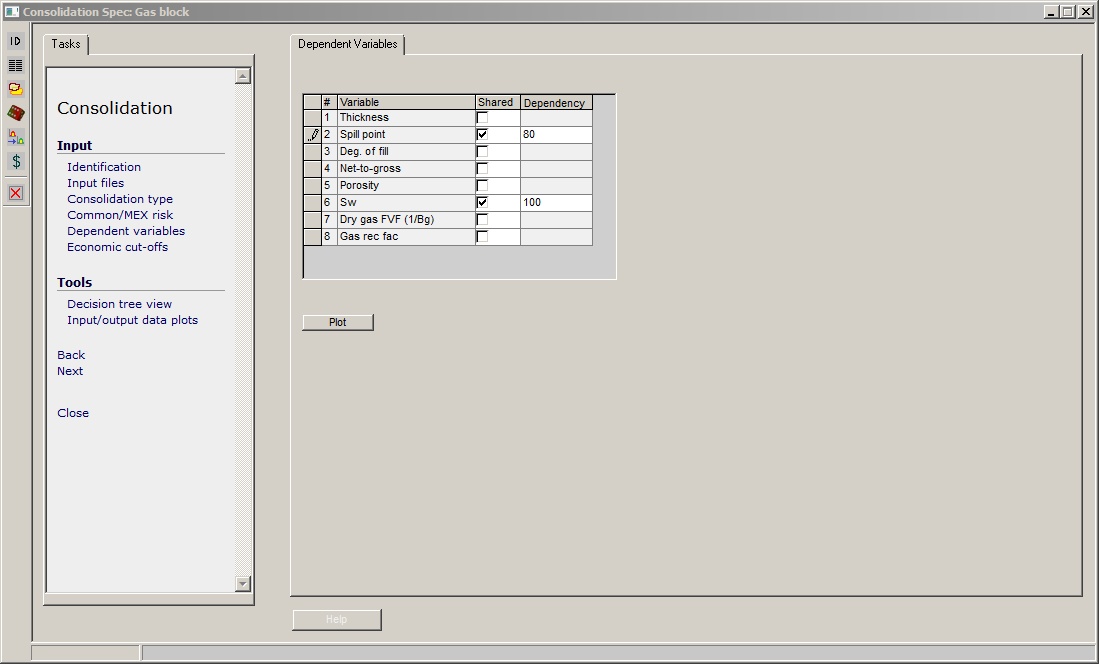
You decide which variable(s) are shared, check the box, and enter a degree of dependency.
Consolidation variable dependencies are of relative type, and can be either positive or negative. This means that the dependency is though the sampling, so that a high sample value chosen for one variable will lead to a high (if the dependency is positive) sample value being chosen for the others. For more information about this (albeit in a prospect context) or if you have insomnia click here.
If the dependency is negative, the choice of value of the variable in the first input determines the values of all the rest, all of which depend negatively on it. It is clear what is going on if there are just two inputs, but if there are more the results may be less easy to support.
The Plot button brings up a dialog where input variables (with or without dependency) from two prospects are plotted against each other. Choose the variable to plot in the Variables tab, and the prospects for the x- and y-axes from the Prospects tab. Here is an example of spill point with 80% dependency:
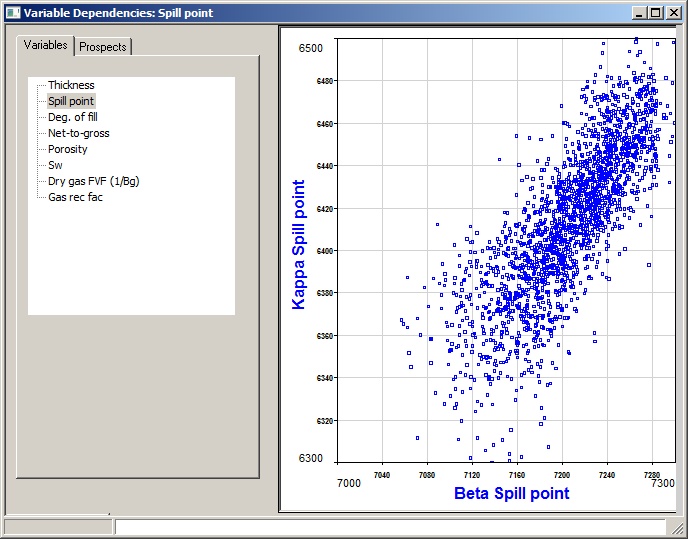
The plot is constructed by running a short consolidation and noting the values of the two variables, so it does represent what will happen when you do the real thing. Note that it may be a bit ragged at the extrema, especially with normal and log-normal distributions. This is because the end "bins" can be rather wide, and are sub-sampled. The dependency on is bin number, and not on sub-sampled bin number. The error is negligible.