Deterministic probabilities |
  
|
Deterministic probabilities |
|
It can be interesting to know where, on an input variable or output result probability distribution, a single ("deterministic") values lies. This facility allows you to do that for all the input and output distributions. The dialog is shown here Note that the only entry is in the "Deterministic" column.
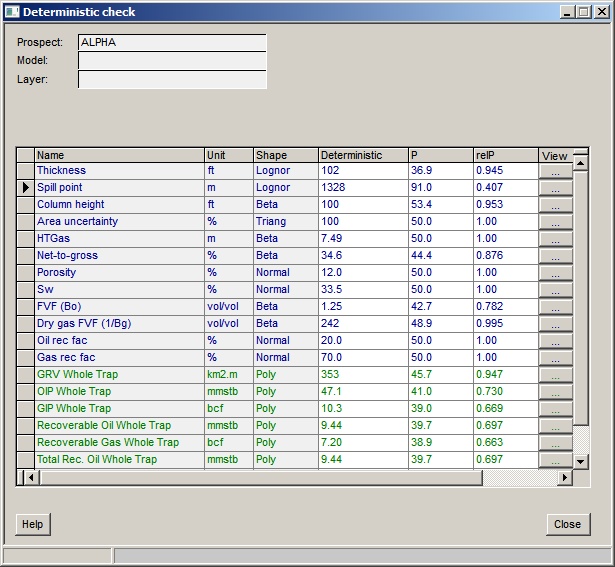
Columns |
|
Name |
The name of the input variable (in blue) or the result (in green) |
Unit, shape |
The unit and shape of the probability distribution |
Deterministic |
The single value for which a probability on the distribution will be calculated. This column is therefore an input field. If no deterministic value has been previously defined it will use the mean. |
P |
The cumulative probability (in %) of the deterministic value entered in the previous column, according to the entered probability distribution. |
relP |
The relative probability according to the distribution. The modal value is 1. Note that this is an unscaled and indicative value. Unless the variable is single valued the probability of any particular value occurring is approximately zero, because there is an infinite range of real numbers between the minimum and maximum of the distribution. |
View |
Click to view/edit the input variable probability distribution. Nothing happens if you click this button for a result distribution. |
Note: if P and relP are 0 for all entries, recalculate the prospect. This can happen with older file versions.
If a row goes red, it indicates that the deterministic value you have entered is outside the range of the probability distribution.