Sensitivity plots |
  
|
Sensitivity plots |
|
There are two formats of sensitivity plot: Spider and Tornado. The tornado plot is a simplified (and perhaps more management friendly) version of the spider plot.
To make the spider plot for a hydrocarbon phase (oil, gas, etc.), the program first calculates a "P50 base case" using P50 values of all the input variables. This gives a certain reserve amount.
Then, varying each input variable in turn, it works out the percentage change in the P50 reserve for a given P level of the input variable. For example, it takes porosity and uses the P99, P95, P90, P80.... P20, P10, P5 and P1 porosity values, in turn, to work out a corresponding reserve level. This is divided by the base case reserve to give a percentage change in reserve for each P level.
It does these calculations for each input variable. The spider plot shows these variations for each variable. An example is shown below:
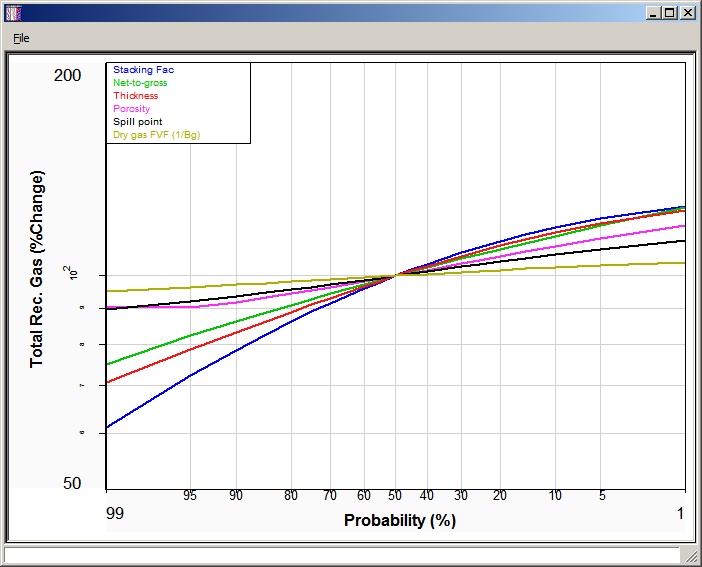
[Note: The y-axis (Reserves % change) is logarithmic in scale and the x-axis is a probability scale. For friendly distributions (i.e. not histograms) this tends to give a smooth curve, and a straight line for a true log-normal shape.]
This graph can be a little complicated to explain to management and investors; a relative uncertainty plot may be more useful.
In the tornado chart, the same data as the spider plot is used. The end points of each variable's bar are the change in volume at the P90 and P10 values or the variable. The width of the bar therefore indicates uncertainly.
The volume referred to is recoverable or in-place, depending on what you are showing on the summary screen.
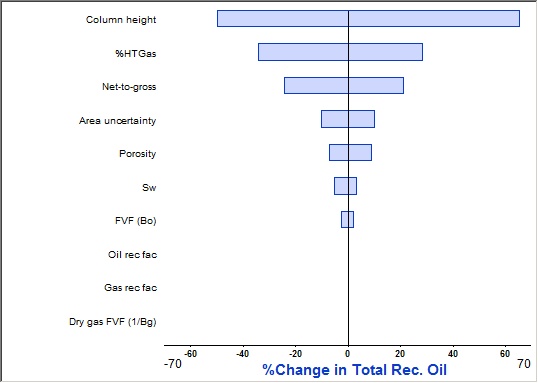
The above example gives a clear message that column height is where most of the uncertainly lies.
Note that the graph shows no sensitivity at all to oil recovery factor, gas recovery factor or gas formation volume factor. The reason is that the volume referred to is recoverable oil, so the gas factors do not apply. Oil recovery factor is - in this case - fully dependent on net-to-gross, so it plays no part either.